
The data is from 2017 but still incredibly useful.
The Chesapeake Bay Program's Chesapeake Behavior Change website has reported this and other data along with behavior scores (likelihood for change). The information is based on the results of the Stewardship Index Survey and offers insights into the opportunities for individual environmental stewardship as well as environmental challenges which may persist due to insufficient interest or traction.
The Stewardship Index Survey assessed the status of 20 behaviors in five categories—dog waste, down the drain, litter, managing rainwater, yard and garden—and the results were used to tally behavior scores, the average of opportunity and likelihood of adoption. The higher the behavior score, the better chance the change would happen. The lower the score, the worse the chance for change.
Yard and garden (created a rain garden), managing rainwater (downspouts drain to hard surfaces), and managing rainwater (have a rain barrel) all had a behavior score above 50. At the other end of the spectrum, littering had a behavior score of 10, meaning it was the least likely of all the behaviors to be changed by individuals. Also ranking low were flushing drugs down the drain and blowing leaves and yard clippings onto hard surfaces.
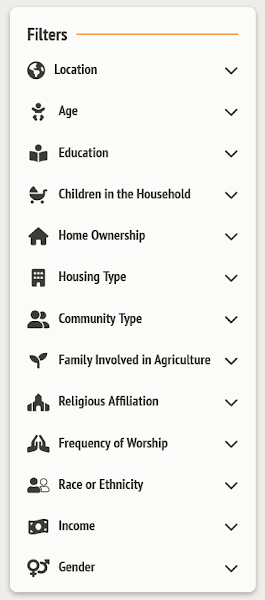
The site is interactive; this allows users to filter and sort results in various ways, including by state and area (including Virginia Tidewater which encompasses the NNK, Middle Peninsula, counties to the south and west, and the Eastern Shore) and socio-economic factors such as education, income, and homeownership status. The data can also be sliced and diced by religious affiliation and frequency of worship.
The raw data and behavior scores can be used by a range of organizations—from formal to informal, from HOAs to nonprofits—to effect individual change in positive ways (doing more of good things and less of bad things) to benefit the environment. Toward this end, the site provides a place to document and share local environmental improvement campaigns.
St. Mary's River Watershed Association, for instance, implemented Communities with LID Practices as the Social Norm as a way to reduce the impact of development starting at the very beginning of the process. Separately, the environmental organization encourages residents to sign the River Friendly Program Behavior Change Pledge Form (PDF) and to use the From My Backyard to Our Bay, A Resident's Guide to Improving Our Environment and Drinking Water.
The Chesapeake Bay Program intends to repeat the survey every five years, making 2022 another implementation year.